

The content of aluminum and iron in slag was determined by colorimetric method
1. Experimental part
Under acidic conditions, Fe3+ and Al3+ in the solution react with the test iron reagent to form different metal complexes. The absorbance values at different wavelengths are determined by using the test solution as a reference in the same colorimetric dish. The absorbance value representing the content of aluminum was measured at the wavelength of 425nm; The absorbance value representing the iron content measured at the wave length of 610nm.
1.1 Main instruments and reagents
(1) Ultraviolet-visible photometer (Shanghai Meishe Instrument Co., LTD.), wavelength range: 200~1000nm.
(2) Color developing agent: test iron Ling solution; Fully dissolve 0.5000g test iron line reagent in about 200mL distilled water, filtrate obtained after filtration, transfer the filtrate to 500mL brown bottle, then add 10mL concentrated hydrochloric acid solution and 10mL concentrated nitric acid solution, shake well at a constant volume, and store away from light [1].
(3) Preparation of acetic acid-ammonium acetate buffer solution: fully dissolve 400g ammonium acetate in about 400mL distilled water, then add 150mL acetic acid solution, transfer to 1000mL, and shake well in a constant volume bottle.
(4) 1% of sodium hydroxide solution configuration: fully dissolve 1g sodium hydroxide in about 50mL of distilled water, transfer to 100mL, and shake well in a constant volume of volumetric bottle.
(5) Preparation of mixed acid solution: Mix 10mL concentrated nitric acid and 5mL concentrated hydrochloric acid, transfer to 250mL brown volumetric bottle and shake well.
(6) Iron standard solution (Fe3+) 100μg/mL.
(7) Aluminum standard solution (Al3+) 100μg/mL.
1.2 Drawing of standard curve
Draw 3 standard working curves as follows:
(1) At the wavelength of 425nm, the standard curve drawn with the mass concentration of the standard solution of iron (μg/100mL) and its corresponding absorbance. Absorb 25mL100μg/mL of iron standard solution in a 500mL volumetric bottle, dilute to 500mL, and mix well. 5μg/mL of iron standard solution is obtained. Accurately measure 5μg/mL iron standard solution of 0.00, 2.50, 5.00, 10.00, 15.00 and 20.00 mlrespectively into 100mL volumetric bottle and add distilled water to dilute to about 50mL. Add 1% sodium hydroxide solution (4) 4mL and mixed acid solution (5) 2mL successively, then add 25mL acetic acid-ammonium acetate buffer solution, mix well. Mix well. Use a pipette to accurately absorb 10mL of test iron line solution and add it to the test solution, shake well at a constant volume, and wait for 25min to start color comparison [2]. With a 752 type UV-visible photometer, the test wavelength was set at 425nm, and the absorbance of the standard series was determined with a 2cm thick cuvette, taking the test liquid as the reference. The first standard curve was measured.
(2) Set the test wavelength to 610nm, and the standard working curve drawn by the mass concentration of iron standard solution (μg/mL) according to its corresponding absorbance (FIG. 1). Measured according to the steps of the first standard curve, only need to adjust the wavelength from 425nm to 610nm when colorimetric.
(3) Set the test wavelength to 425nm, and the standard curve drawn by the mass concentration of aluminum standard solution (μg/mL) with its corresponding absorbance (Figure 2). Absorb 25mL100μg/mL aluminum standard solution into 500mL volumetric bottle, dilute to 500mL, mix well, obtain 5μg/mL aluminum standard solution. Follow the same steps as the first standard curve.

1.3 Sample Treatment
Accurately weigh about 0.1g sample into 200mL polytetrafluoroethylene beaker, add a little distilled water to moisten the sample, then add 10mL concentrated hydrochloric acid, 5mL concentrated nitric acid and 2mL hydrofluoric acid, then slowly drop 10mL concentrated sulfuric acid into the beaker, and slowly shake the beaker to fully mix the solution. Heat the sample on the electric heating plate until white smoke of perchloric acid emerges, continue heating for about 15min, remove the beaker and rest on the refractory plate to cool. Add 20mL of (1+1) hydrochloric acid solution and about 250mL of distilled water, heat and boil for 30min, then cool, transfer to a 500mL volumeter bottle, shake well at a constant volume. If there is still precipitate in the solution, it is necessary to dry filter, accurately absorb 50mL filtrate into a 250mL volumeter bottle, and shake well at a constant volume [3].
Use pipette to accurately absorb 10mL test solution into 100mL volumetric bottle, add about 30mL distilled water, 1% sodium hydroxide solution (4) 4mL and mixed acid solution (5) 2mL, shake fully and mix well, then add acetic acid-ammonium acetate buffer solution 25mL, accurately add 10mL test iron solution, shake well at constant volume. Let it stand for 25min and then start to compare colors. A 752 UV-VIS photometer was used to determine the absorbance and iron content in a 2cm thick colorimetric dish at the test wavelength set at 610nm and the test liquid as a reference. Then at the wavelength of 425nm, the absorbance was determined with the same colorimetric dish and the same reference, and the combined amount of iron and aluminum was obtained.
1.4 Calculation of results
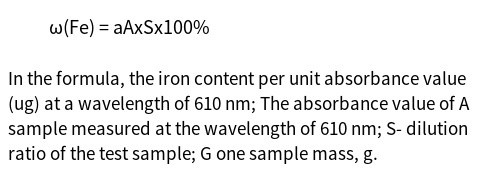
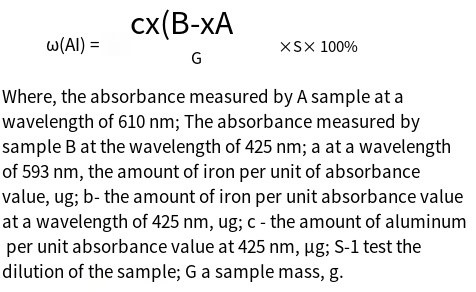
2. Results and Discussion
2.1 Methods Comparative experiment
See Table 1 for the results of comparison experiments between this method and EDTA volumetric method. The comparison shows that the maximum relative deviation between the 1# sample with low content and the standard value is 4.78%, and the other test values are no more than 3%. The deviation of the comparison data by this method is in a reasonable range.
2.2 Experiment of recovery rate of standard addition
In the color developing sample of method 2.1 comparison experiment, 2μg/mL and 5μg/mL aluminum and iron standard solution were added respectively at the constant volume of 100mL color developing, and the measured data should be 5% and 12.5% higher than the original result. The actual test results are shown in Table 2. As shown in Table 2, the aluminum recovery rate of 2# samples was 104.4% after adding 2μg/mL, which was slightly higher, and the recovery deviation of other samples was less than 3%. Table 3 shows that the recoveries of aluminum and iron are controlled within ±3% after adding 5μg/mL, and the relative deviation is within the controllable range.
2.3 Precision experiment of the method
In the color developing samples of method 2.1, the deviation of 3# samples was monitored through the monitoring and warning model to monitor these health indicators and make them within a reasonable range. If these health indicators exceed the limit of the fitted curve, a warning and alarm will be given. The system also evaluates the accuracy of the chromatogram, provides an alarm for operation information, and gives the uncertainty of gross calorific value and the uncertainty of standard density according to the standard.
According to the built-in pre-diagnosis model, the system combines the operating data of the measuring equipment to realize the metering loop diagnosis. The system will judge such as probe damage, pipeline dirt, rectifier plate blockage and other conditions and put forward an alarm, and give corresponding suggestions.
FIG. 2 shows the change trend of gain value of this flowmeter after calibration and reassembly. When the meter has been in operation for 6 months, the gain value increases abnormally, and there will be problems in predicting the probe.
|
Table 1 Comparison of results between this method and EDTA volumetric method |
||||||
|
Sample number |
EDTA capacity method |
Present method |
Nominal value |
|||
|
ω(AI) (%) |
ω(Fe) (%) |
ω(AI) (%) |
ω(Fe) (%) |
ω(AI) (%) |
ω(Fe) (%) |
|
|
1 |
2.56 |
18.30 |
2.39 |
18.46 |
2.51 |
18.40 |
|
2 |
3.31 |
25.26 |
3.10 |
24.80 |
3.22 |
25.02 |
|
3 |
5.01 |
16.09 |
4.91 |
16.24 |
5.17 |
16.12 |
3. Sound velocity and flow check function
Sound velocity verification is an important means in ultrasonic measurement. The significance of sound velocity verification is that if the deviation of sound velocity exceeds the range specified in the standard, it indicates that there are problems in the measurement system, which may come from the temperature, pressure, chromatography and so on. Therefore, for actual use, the more real-time sound velocity verification, the better, the faster the response speed, the better. The more real-time, the faster the problem can be found.
The sound velocity calculation function of AGA10[1] is built in the diagnostic system, and the theoretical sound velocity obtained is compared with the measured sound velocity of the ultrasonic flowmeter in real time to ensure that the metering system operates in the normal range. In the installation of on-line chromatography field station diagnostic system can be real-time sampling and according to AGA10 standard calculation of theoretical sound velocity, calculate sound velocity deviation, and record these "footprints" for real-time verification.
The system also realizes the metering branch flow check function. The system will capture the real-time parameters of a branch, calculate the actual flow according to these parameters, and compare with the actual flow rate of the flow computer. If the deviation is exceeded, the alarm will be given.
4. Conclusion
In summary, the ultrasonic flowmeter remote diagnosis system realizes the remote, online and real-time collection of natural gas measurement data, carries out remote online diagnosis and in-use inspection of the ultrasonic flowmeter for natural gas, and realizes the dynamic real-time monitoring of the use of natural gas. The system monitors the operating status of the natural gas metering system in real time, and alerts the faults and abnormal situations to ensure the accurate and stable operation of the metering system and solve the problems in the measurement management of natural gas trade.